

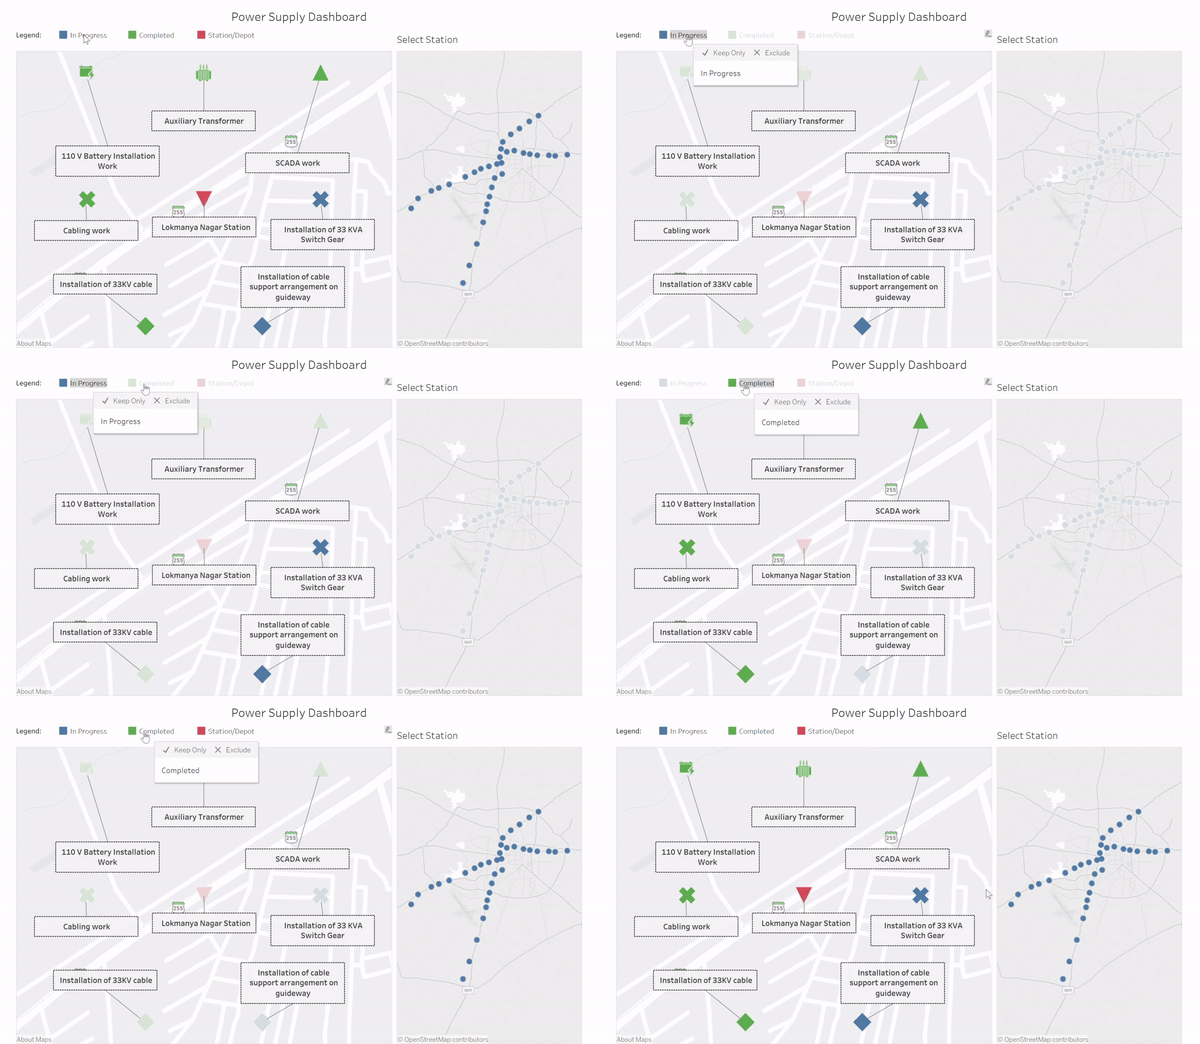
How often in a construction project does one need to monitor what component of work has been completed at a particular location? Almost too often. That is exactly what the above dashboard is demonstrative of. A map on the right allows the user to select a location and the map on the left shows what pieces of work at that location have been completed/are under progress.
Created on: Tableau
Dashboard Features:
1. Interactivity
2. Details-on-Demand
3. Filtering
4. Scalability
5. Analytics
6. Drill Down Capability
How about tracking progress on schematics and drawings instead of on a map? This dashboard allows a user to select a drawing from a drop-down list and track the progress of components on that drawing along the project timeline.
Created on: Tableau
Dashboard Features:
1. Interactivity
2. Details-on-Demand
3. Filtering
4. Scalability
5. Analytics
6. Drill Down Capability
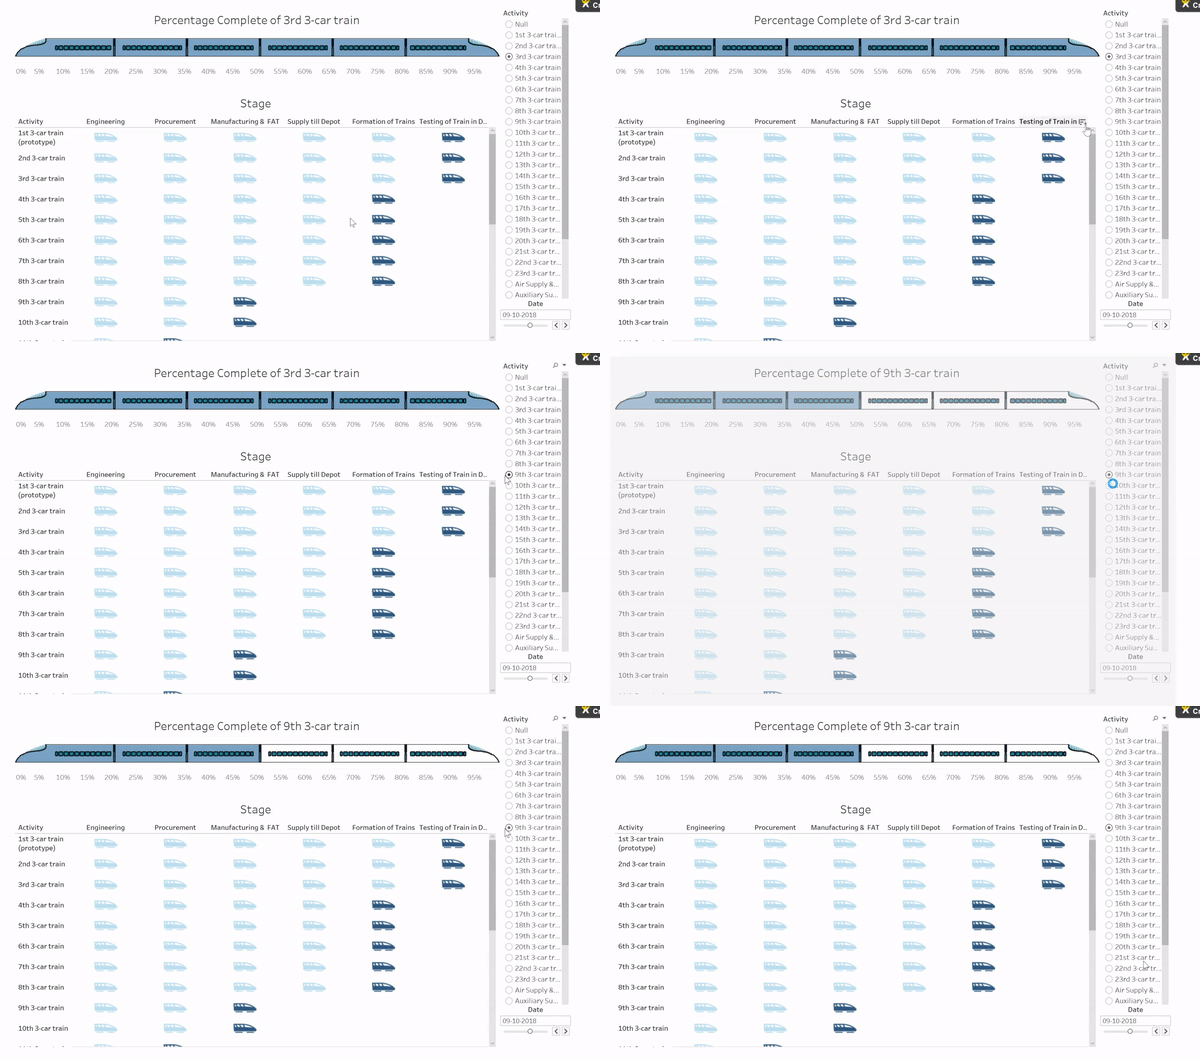
Multiple stages of progress to be tracked across multiple activities? This rolling stock dashboard provides a quick and accurate summary of such sequential activities.
Created on: Tableau
Dashboard Features:
1. Interactivity
2. Details-on-Demand
3. Filtering
4. Scalability
5. Analytics
6. Drill Down Capability
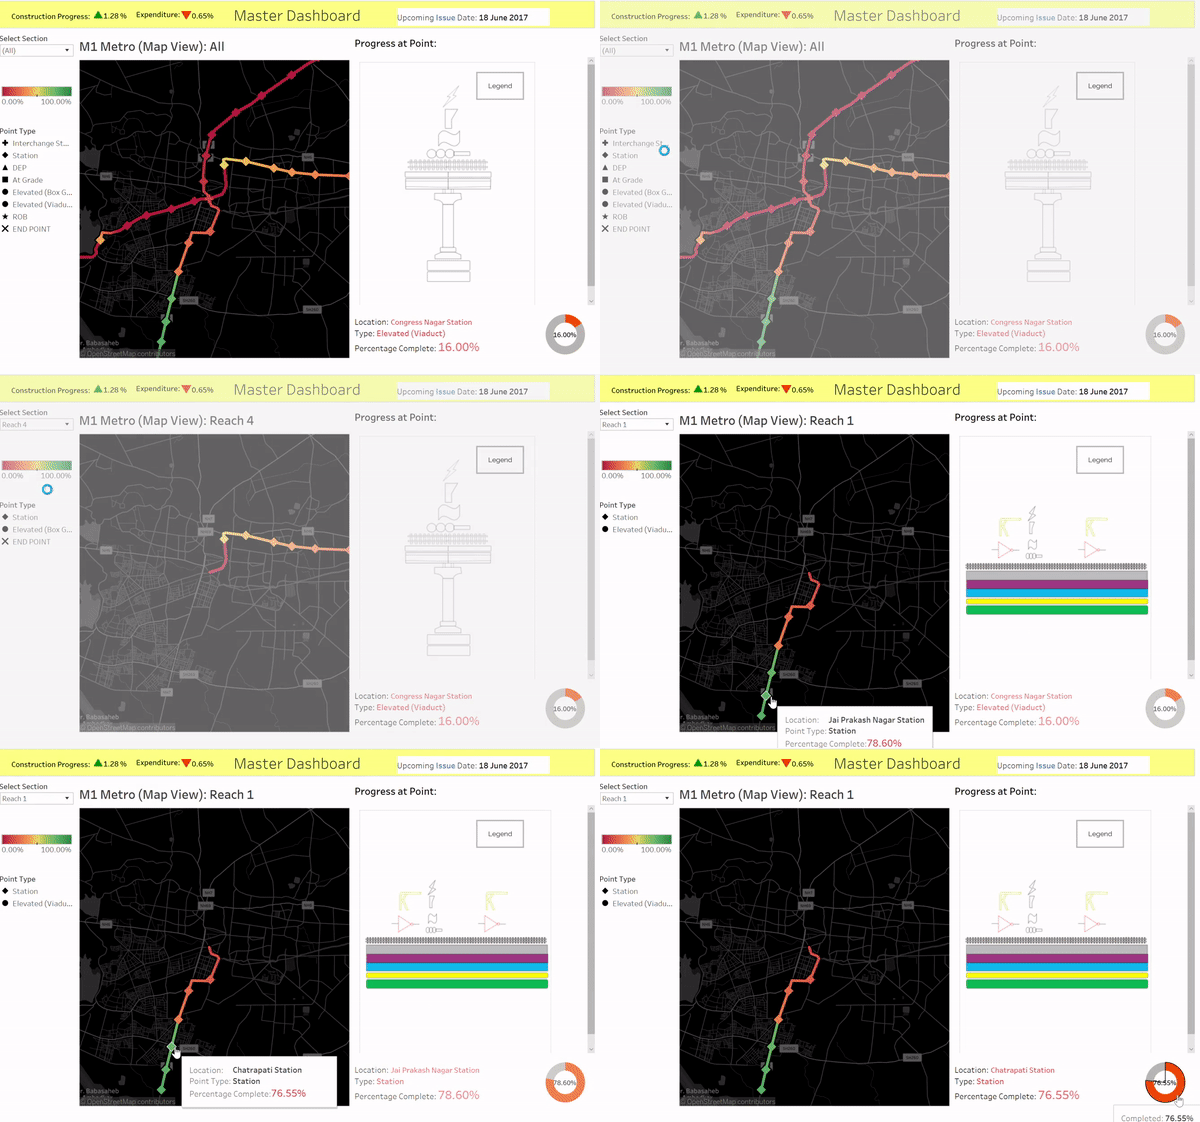
How about a one-view project summary to begin your day? The Master dashboard directs your effort towards areas in the project that need it most.
Created on: Tableau
Dashboard Features:
1. Interactivity
2. Details-on-Demand
3. Filtering
4. Scalability
5. Analytics
6. Drill Down Capability
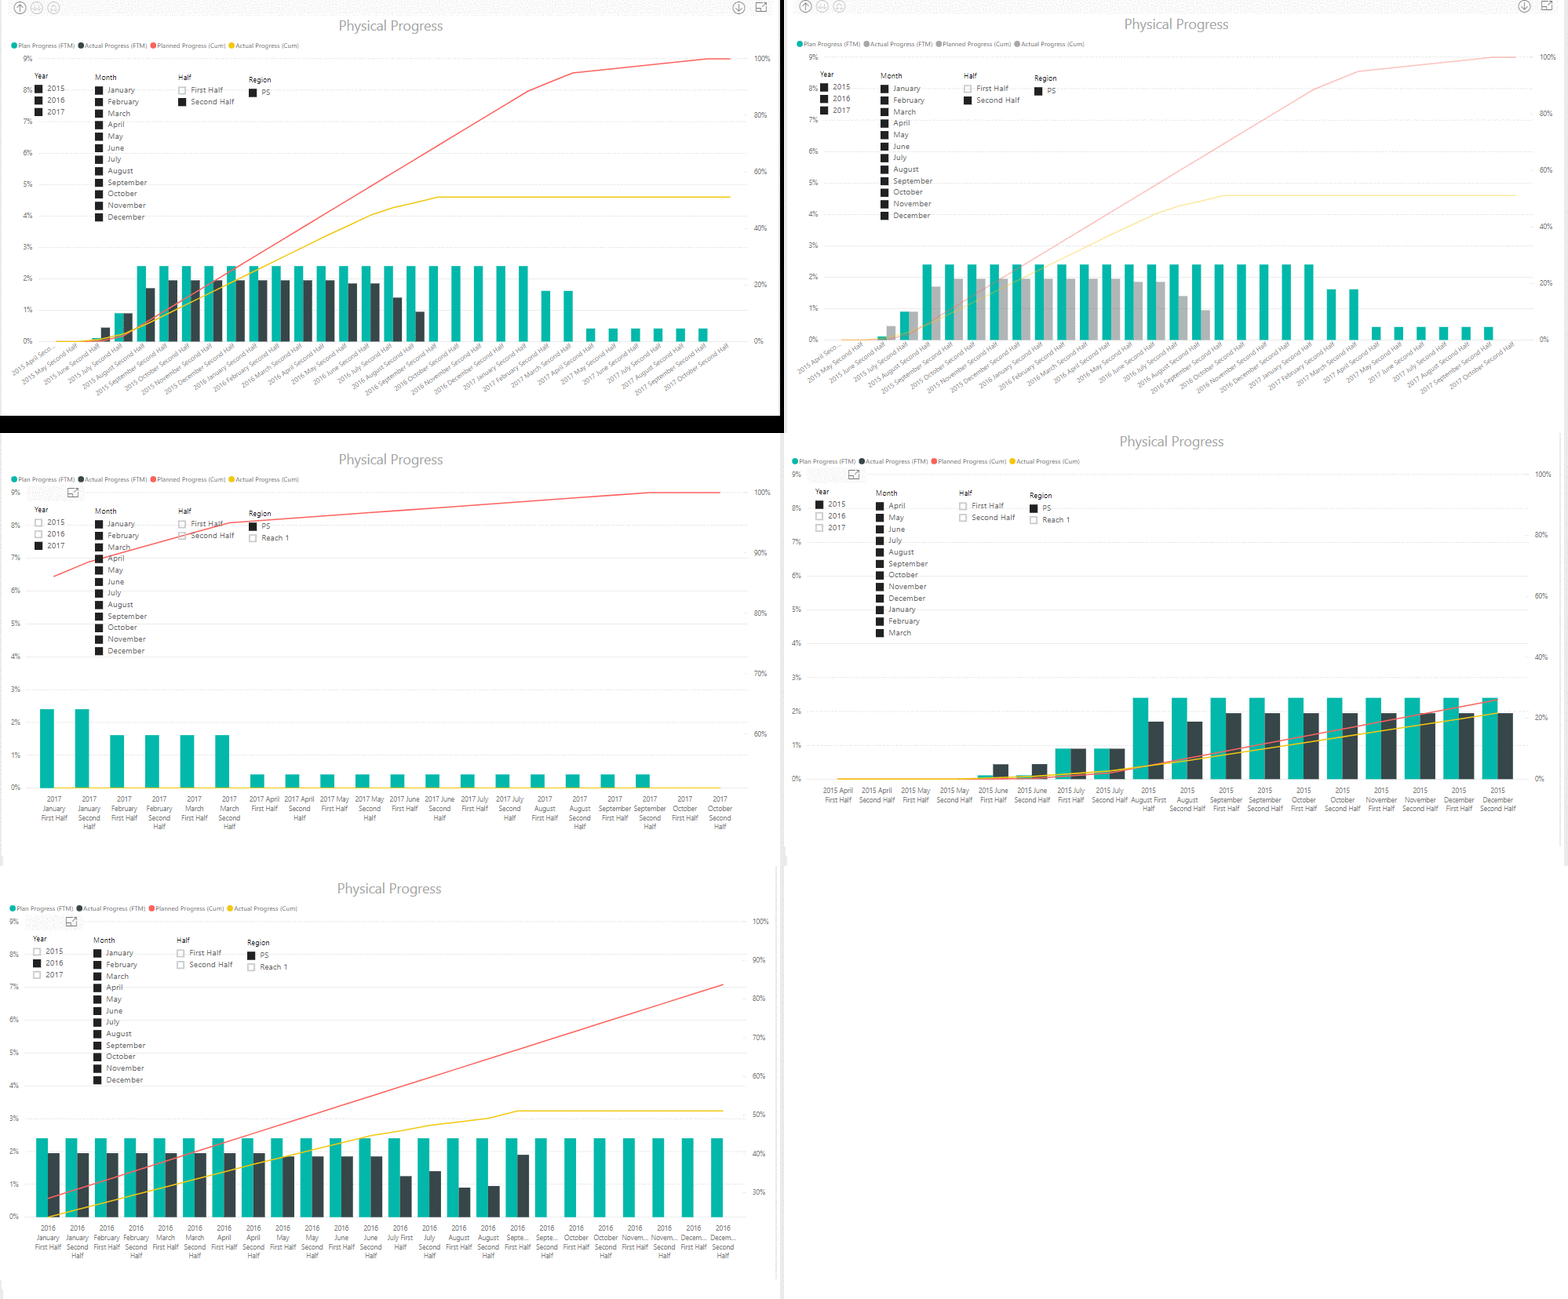
A by-the-numbers progress dashboard. Progress data coming in from Primavera P6 construction schedules exported in XML format.
Created on: MS PowerBI
Dashboard Features:
1. Interactivity
2. Details-on-Demand
3. Filtering
4. Scalability
5. Analytics
6. Drill Down Capability
Geographical footprint of projects.
Created on: MS PowerBI
Dashboard Features:
1. Interactivity
2. Details-on-Demand
3. Filtering
4. Scalability
5. Analytics
6. Drill Down Capability


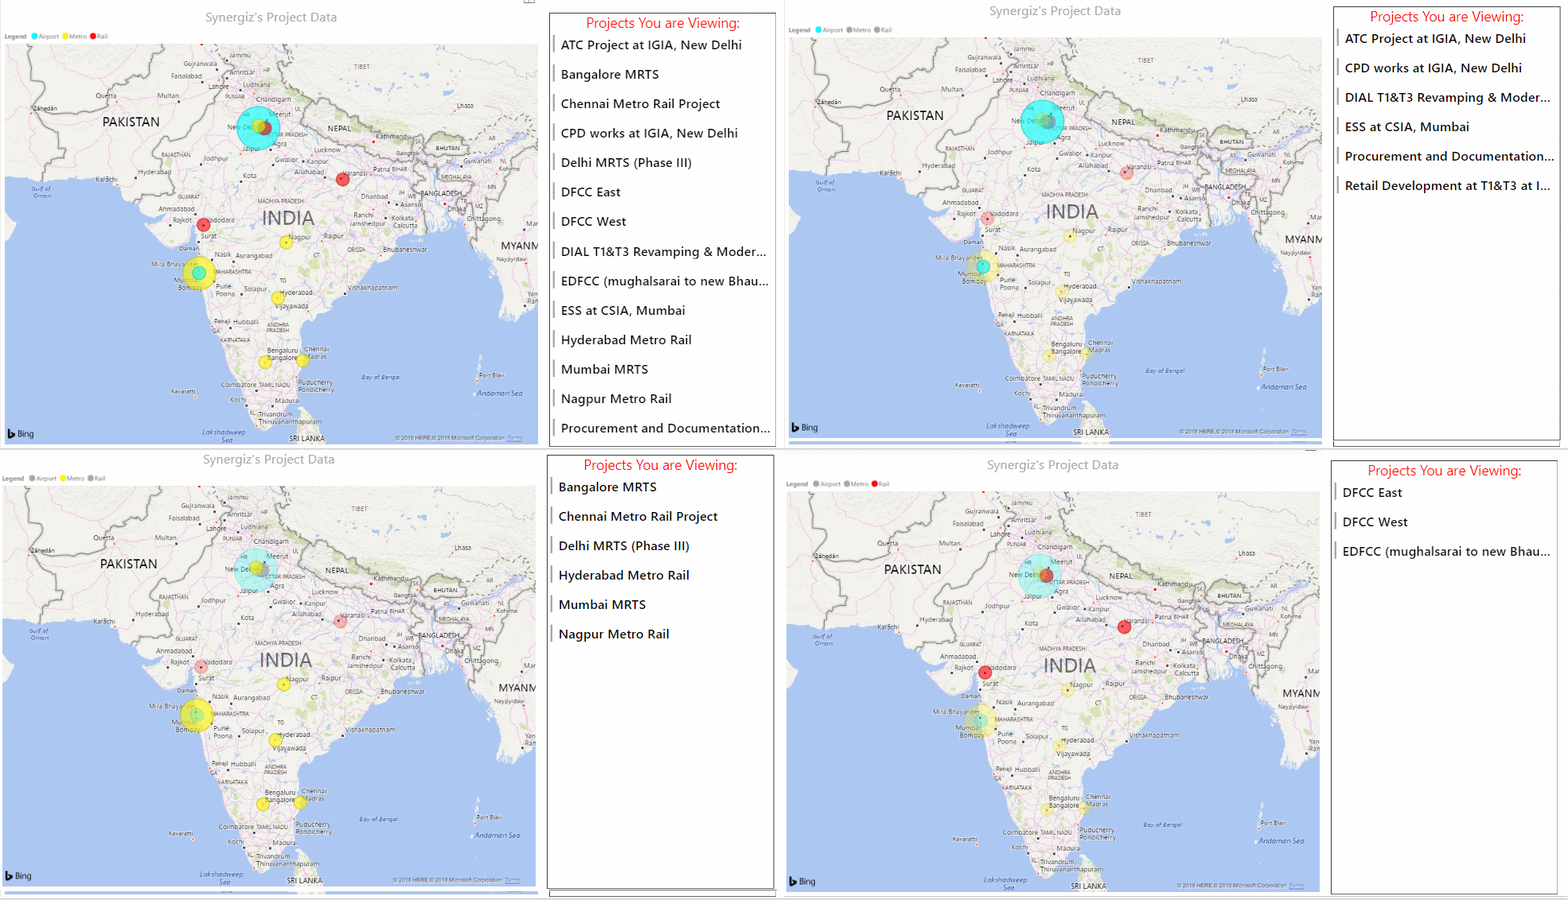
Geographical footprint of projects: (interactive sample)